

There are 2 useful tools for seeing whats running, one is pre installed in most Linux distributions and one can be easily installed.
Top and HTop are very similar programs except HTop is much more graphical (even through putty).
to run top just type:
Code: Select all
top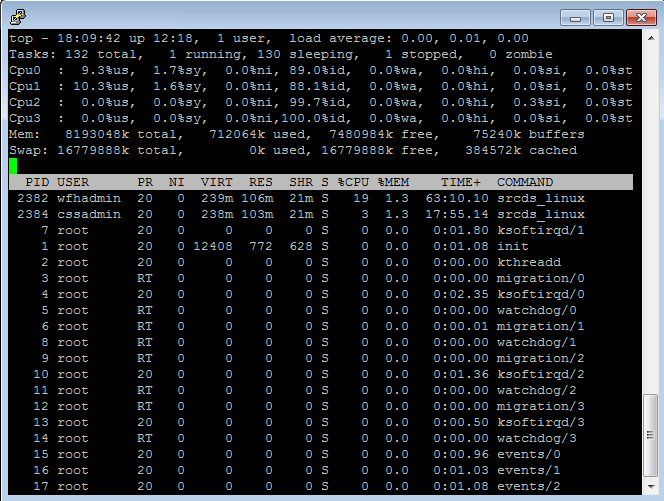
You can then press "h" for help on commands.
Pressing "u" allows you to select a single process user account.
Pressing "1" allows you to see the processors as individual stats.
Pressing "k" allows you to kill a process, just enter the "PID" number listed and hit enter twice.
Pressing "q" quits the program.
I tend to prefer HTop for no real reason except it shows a slightly more granular view of process and also shows related processing "threads" (other process which either depend on the one process or a process which this one relies on).
to install
Code: Select all
zypper install htopCode: Select all
htop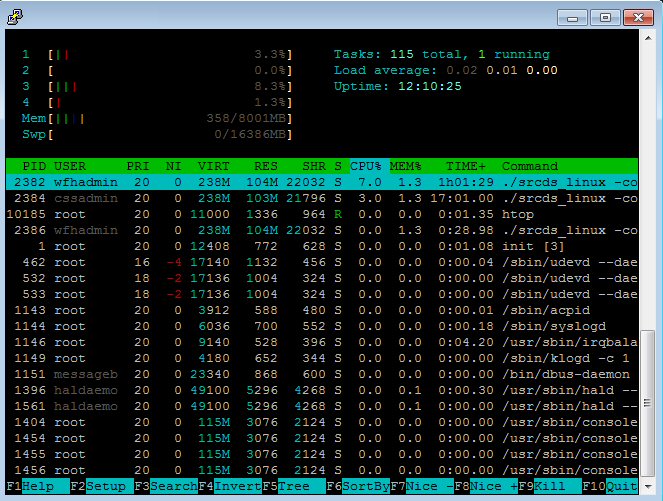
HTop uses colour and key presses to select things (like the old midnight commander module which will be descibed later).
The coloured bars show each processor thread use(not just number of cores as some are multi threaded on top of multi cored - like the i7 quad core which has 8 threads), also shows memory and swap file useage.
Keys are listed along the bottom and you can select processes using the arrow keys.